Quote

Financial Highlights & Segment Information
Financial Highlights
(Millions of Yen)
| Fiscal Year | Mar. 2018 | Mar. 2019 | Mar. 2020 | Mar. 2021 | Mar. 2022 |
|---|---|---|---|---|---|
| Consolidated | |||||
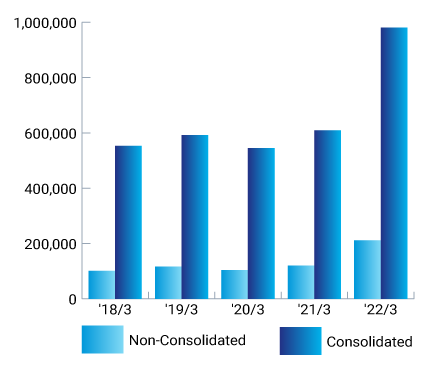
| Net Sales | 553,197 | 592,009 | 544,533 | 609,110 | 980,441 |
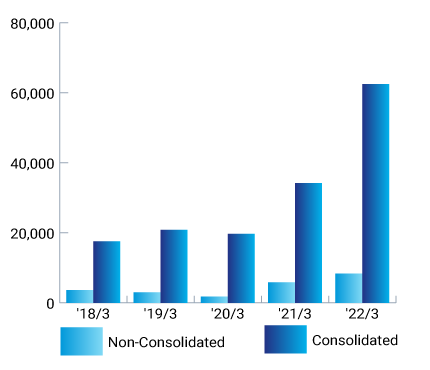
| Operating Income | 17,551 | 20,797 | 19,714 | 34,177 | 62,475 |
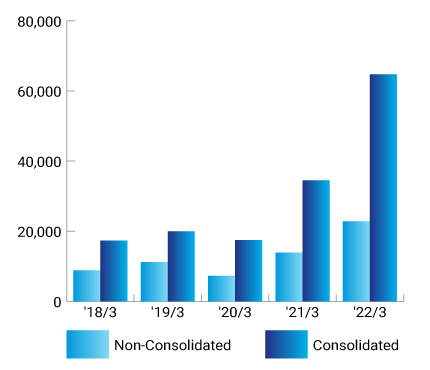
| Ordinary Income | 17,345 | 19,939 | 17,432 | 34,529 | 64,733 |
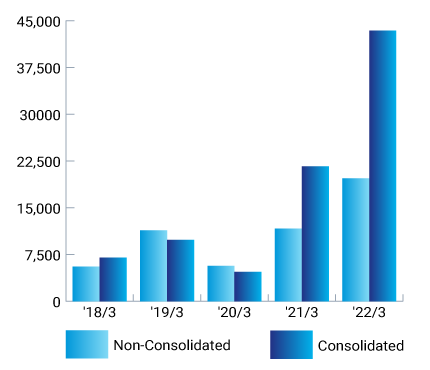
| Net Income Attributable to Owners of the Parent |
7,002 | 9,857 | 4,724 | 21,644 | 43,417 |
| Non-Consolidated | |||||
| Net Sales | 101,145 | 116,197 | 103,788 | 120,326 | 211,293 |
| Operating Income | 3,643 | 2,949 | 1,772 | 5,808 | 8,363 |
| Ordinary Income | 8,829 | 11,204 | 7,238 | 13,877 | 22,815 |
| Net Income | 5,555 | 11,383 | 5,682 | 11,658 | 19,708 |
Net Sales (Millions of Yen)
Operating Income (Millions of Yen)
Ordinary Income
(Millions of Yen)
Net Income Attributable to Owners of the Parent /
Net Income (Millions of Yen)
| Fiscal Year | Mar. 2018 | Mar. 2019 | Mar. 2020 | Mar. 2021 | Mar. 2022 |
|---|---|---|---|---|---|
| Consolidated per Share Data | |||||
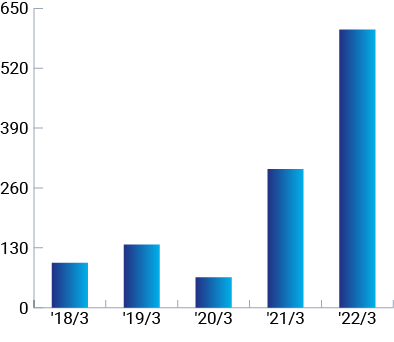
| Net Income per Share (EPS) (Japanese Yens) |
97.26 | 136.91 | 65.68 | 301.06 | 603.90 |
Net Income per Share (EPS) (Japanese Yens)
| Fiscal Year | Mar. 2018 | Mar. 2019 | Mar. 2020 | Mar. 2021 | Mar. 2022 |
|---|---|---|---|---|---|
| Consolidated | |||||
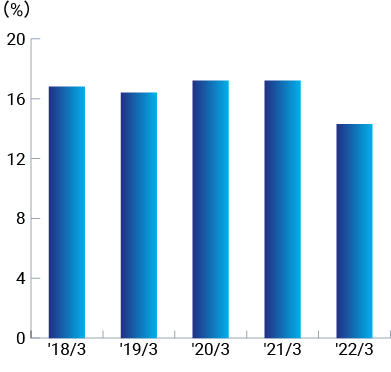
| Operating Gross Profit Margin | 16.8% | 16.4% | 17.2% | 17.2% | 14.3% |
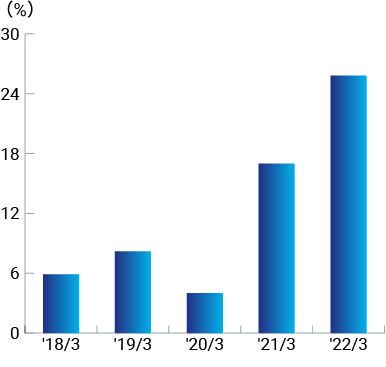
| Return On Equity (ROE) | 5.9% | 8.2% | 4.0% | 17.0% | 25.8% |
Operating Gross Profit Margin (%)
Return On Equity (ROE) (%)
Segment Information
Net Sales by Segment (Millions of Yen)
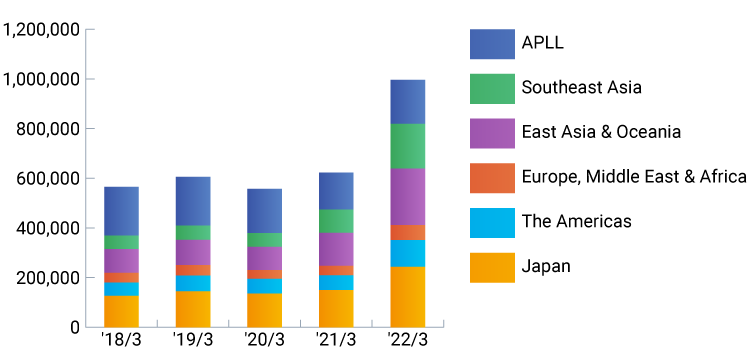
(Millions of Yen)
| Japan | The Americas |
Europe, Middle East & Africa |
East Asia & Oceania |
Southeast Asia |
APLL | Other | Unallocated | Total | |
|---|---|---|---|---|---|---|---|---|---|
| Mar. 2022 | |||||||||
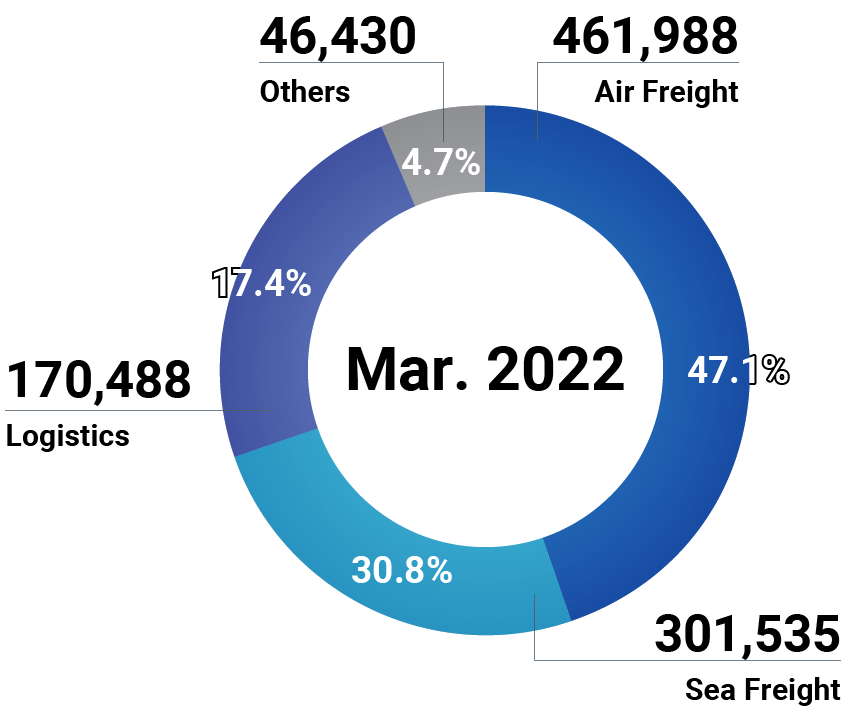
| Net Sales | 244,073 | 107,880 | 60,479 | 227,326 | 179,989 | 196,379 | 3,626 | (39,312) | 980,441 |
| Operating Income | 11,566 | 13,332 | 4,297 | 16,216 | 13,277 | 3,393 | 389 | 2 | 62,475 |
| Mar. 2021 | |||||||||
| Net Sales | 150,680 | 59,323 | 38,097 | 132,972 | 93,449 | 148,108 | 2,738 | (16,259) | 609,110 |
| Operating Income | 8,229 | 5,136 | 1,335 | 11,134 | 8,013 | (19) | 317 | 30 | 34,177 |
| Mar. 2020 | |||||||||
| Net Sales | 136,808 | 58,793 | 35,391 | 93,947 | 54,783 | 177,147 | 2,727 | (15,066) | 544,533 |
| Operating Income | 4,667 | 3,755 | 321 | 5,125 | 2,302 | 3,220 | 303 | 18 | 19,714 |
| Mar. 2019 | |||||||||
| Net Sales | 145,669 | 63,476 | 41,934 | 101,531 | 57,966 | 194,982 | 2,685 | (16,236) | 592,009 |
| Operating Income | 5,777 | 3,597 | 1,402 | 5,193 | 2,661 | 1,997 | 145 | 20 | 20,797 |
| Mar. 2018 | |||||||||
| Net Sales | 127,807 | 53,219 | 38,636 | 96,131 | 54,716 | 194,860 | 2,283 | (14,458) | 553,197 |
| Operating Income | 6,189 | 3,582 | 623 | 5,634 | 3,257 | (1,986) | 244 | 4 | 17,551 |
Net Sales by Business (Millions of Yen) Mar.2022